Updated: 1.09.2019
wersja w języku polskim
Among the area of my research, introduced in a synthetic way in the Summary of Professional Accomplishments (SPA), as the most important and the main research current I considered the achievements in the domain of the computer methods for non-invasive three-dimensional tomographic diagnostic and fuzzy control dedicated to the two-phase flow processes.
Hence, in a frame of the achievement the mono-thematic series of research papers which consists of eight articles. They have been listed in table 1 in chronological order
Table 1: List of the mono-thematic series of papers according to the article 16 paragraph 2 of the Law on Academic Degrees and Title and Degrees and Title in the Arts
| Ref number | Article |
| I.B.1. | R. Wajman, R. Banasiak, Ł. Mazurkiewicz, T. Dyakowski, D. Sankowski „Spatial imaging with 3D capacitance measurements”; Meas. Sci. Technol. 17 (July 2006) pp. 2113-2118 DOI: 10.1088/0957-0233/17/8/009 |
| I.B.2. | R. Wajman, R. Banasiak, Ł. Mazurkiewicz, D. Sankowski „Reply to comments on ‘Spatial imaging with 3D capacitance measurements’”; Meas. Sci. Technol. 18 No 11 (November 2007) pp. 3668-3670 DOI: 10.1088/0957-0233/18/11/N02 |
| I.B.3. | M. R. Rząsa, R. Wajman „Dobór metody wyznaczania mapy czułości dla tomografu pojemnościowego o zwiększonej czułości przy ściance” ; Automatyka 13/3 (2009), AGH, Kraków, 1361-1368 |
| I.B.4. | R. Wajman, P. Fiderek, H. Fidos, T. Jaworski, J. Nowakowski, D. Sankowski and R. Banasiak “Metrological evaluation of a 3D electrical capacitance tomography measurement system for two-phase flow fraction determination”; Meas. Sci. Technol., (2013) Vol. 24 No. 065302 DOI: 10.1088/0957-0233/24/6/065302 |
I.B.5. | R. Banasiak, R. Wajman, T. Jaworski, P. Fiderek, H. Fidos, J. Nowakowski, D. Sankowski „Study on two-phase flow regime visualisation and identification using 3D electrical capacitance tomography and fuzzy-logic classification” International Journal of Multiphase Flow, Vol. 58, (January 2014), pp. 1-14 DOI: 10.1016/j.ijmultiphaseflow.2013.07.003 |
| I.B.6. | R. Wajman, R. Banasiak “Tunnel-based method of sensitivity matrix calculation for 3D-ECT imaging“, Sensor Review, Vol. 34 Iss: 3, (2014), pp.273 – 283 DOI: 10.1108/SR-06-2013-692 |
| I.B.7. | P. Fiderek, J. Kucharski, R. Wajman “Fuzzy inference for two-phase gas-liquid flow type evaluation based on raw 3D ECT measurement data”, Flow Measurement and Instrumentation, Vol. 54, April 2017, pp.88–96 DOI: 10.1016/j.flowmeasinst.2016.12.010 |
| I.B.8. | P. Fiderek, T. Jaworski, R. Banasiak, J. Nowakowski, J. Kucharski, R. Wajman “Intelligent system for the two-phase flows diagnosis and control on the basis of raw 3D ECT data”, IAPGOS, Vol. 7, No. 1, 2017, pp. 17-23, ISSN 2083-0157 DOI: 10.5604/01.3001.0010.4576 |
It is worth to note that my research achievements are the outcomes of my active participation in the international project titled „Development of Excellence in Non-Invasive Diagnostic System for Industrials and Scientific Applications” (acronym DENIDIA) (2006-2010). This project was hosted by the Institute of Applied Computer Science (IIS) of Lodz University of Technology (LUT) and was in a frame of the 6. Frame Program Mobility – Marie Curie Host Fellowships for the Transfer of Knowledge. Additionally, I was the leader of one research project in Computer Science (panel ST6 of MNiSW) and the main contractor in four other projects funded by the National Science Centre. Various publications are the consequence of my research works done in a frame of the mentioned projects. After PhD graduation, I am a co-author of:
- 10 articles published in journals indexed in the JCR database and in the list A of MNiSW,
- 4 chapters in English-language books,
- 1 European patent,
- 24 articles published in journals indexed in the list B of MNiSW,
- 7 projects which were awarded or honoured 16 times in the international inventions exhibitions.
Each time I worked (once as a leader) together with some interdisciplinary research teams together with the scientists of different research areas like computer science, process engineering, automatic, mechanic as well as metrology. Such way of activity attracts the co‑authorship of research publications. Nevertheless, this SPA document explains only my research achievements which state about my contribution to the applications of computer science into the process tomography.
Discussion of the research goals and the obtained results along with the discussion of their utilitarian aspects
Preliminary remarks
The main research area of my interest dedicated to the industrial applications are the computer methods for non-invasive diagnosis and regulation of two-phase gas-liquid flow processes. The main research achievements and the obtained results are discussed here in the form of thematically related articles’ set submitted for evaluation.
The two-phase flow (TPF) processes belong to the most rapidly growing trend in fluid mechanics research. In recent years there has been a significant, but still insufficient progress in the development of knowledge about these industrial processes (Fang Dong et al., 2012). TPFs arouse growing interest because of their great practical significance. They are closely related to the rapidly developing field of research in bioprocess engineering, biotechnology, environmental engineering, energy, and many other related branches.
One of the fundamental problems, where knowledge of which is necessary to describe the hydrodynamics of TPF mixtures, include: determination of the mixtures of TPF’s patterns, determination of the void fraction in the flowing mixture and the flow resistance of mixtures (Cheng et al., 2008; Dziubinski et al., 2004; Ruspini et al., 2014). Besides, for purposes of description of mass transfer in TPF systems we need to know the interfacial surface area, coalescence of gas bubbles and mass transfer coefficient. So far, none of these issues has been satisfactorily presented in the literature. This is due to the complicated mechanism of flow dynamics, often connected with difficulties in its description from the mathematical point of view and it is related to the complicated measurement methods typically used in the TPFs studies.
The two-phase gas-liquid flows are a very important component of many industrial processes (Mokhatab, 2008). One of the numerous examples is the aeration processes (Jothiprakash et al., 2015; Teng et al., 2016) in chemical reactors (Kiambi et al., 2011), in flotation processes (Vadlakonda and Mangadoddy, 2017), in water and sewage aeration systems (Guo et al., 2013). The main task of aeration systems is a production of a proper fraction of aerated liquid and oxygen. Oxygen injection process is important due to the fact that liquid circulation has to be achieved. It helps to intensify a mass transfer process. One of the fundamental problems is a proper evaluation of the inter-phase surface – this is an important parameter from the mass transfer point of view. The example of water and sewage aeration may be biological sewage treatment plants (Beux et al., 2007). An important role in these processes plays aerobic bacteria, which grow only in the presence of free oxygen from the atmosphere or dissolved in water. The level of aeration must be within the specified range, which depends on water temperature. One way of aeration is to inject into the system, compressed air, making the need for freedom of gas bubbles movement in the liquid column up.
The TPF processes also occur in the bubble columns (Abdulmouti, 2015; Delnoij et al., 2000; Mewes and Wiemann, 2003). Their purpose is to implement the various physical and chemical processes. Controlling the size of the interface often determines the progress intensity of these processes. For example, in air-lift columns (Akita et al., 1988; Blažej et al., 2004; Kassab et al., 2009) and ejectors (Balamurugan et al., 2007) the movement of the liquid stream is forced by the gas stream. Such devices are commonly used in the extractive industries (e.g. flotation processes) (Zargaran et al., 2016) or to precipitation of some fraction of the liquid in the sedimentation processes (Malijevsky and Archer, 2013), such as decreasing where the size of bubbles is significant.
There is also a separate group of industrial processes in which gas bubbles may be formed in the liquid as a result of chemical reactions. It can occur for example in chemical reactors or in the process of electrolysis (Lafmejani et al., 2017; Olesen et al., 2016), where the gas phase is a product (often kind of a by-product) of a chemical reaction. Then the appearance of bubbles indicates the quality of ongoing changes, and the measurement of bubble size provides information about the process. There are industrial processes as well in which the occurrence of bubbles is undesirable, such as heat exchangers or heating devices. In these systems, the appearance of unwanted gas gives evidence of boiling liquid phenomenon (Solotych et al., 2016), and enforces signalling state of emergency. This occurs similarly to cavitation phenomena in rotational pumps (Liu et al., 2015; Zhu et al., 2015), which are caused by a rapid decrease in pressure below the pressure of the boiling liquid. This phenomenon is undesirable because it leads to erosion of the pump blades. This phenomenon could also be the evidence of system leakage.
The mentioned above the growing needs of industry for simple, versatile, relatively inexpensive, non-invasive and rapid method of process diagnosis and control for TPFs in horizontal and vertical pipelines justify the importance of my research topic. The knowledge of the characteristics and of the gas-liquid flow type is very important for the design and implementation of industrial-scale research facilities as well as for the process of numerical modelling. The continuous monitoring and diagnosis of any abnormalities can provide valuable information about their dynamic state and allow for continuous and automatic control.
Nowadays, the applicability of similar technologies in modern production systems is the main trend of development and technological progress in many industrial sectors determining thereby the energy-saving and quality enhancing trends. Wherever in the production process the phase mixture is transported and it is not optimal or not economical, there is a need to develop a system which would be able to prevent crashes, unexpected production line hold‑ups or situations where for reasons of bad flow parameters, the final product is defective. Such solution could also be irreplaceable when a flow process requires constant supervision, or when the work environment would be a danger to the safety or cause loss of either employees’ health or life and simultaneously it is required continuous, automated, non-invasive and efficient monitoring of inaccessible parts of pipelines.
Computer methods for three-dimensional tomographic diagnosis
The main aspect of many identification and control systems is a diagnosis of industrial processes. Since many years the research conducted on the two-phase gas-liquid flows still does not deliver consistent answers to many questions according to this phenomenon (Fang Dong et al., 2012). It is because of its stochastic nature as well as its dynamics but also it is related to the research capabilities. In the case of these flow processes, the diagnostic methods developed so far are based on usage of most sophisticated measurement techniques (Brebbia and Mammol, 2011). These methods either did not allow to obtain repeatable results (in most cases the description of the phenomena was ambiguous) (Abbagoni and Yeung, 2016; Arvoh et al., 2012; Bertola, 2003; Ozbayoglu and Ozbayoglu, 2009) or was actually precise enough but interfered with changing of the process features (Venkata and Roy, 2012; Xie et al., 2004).
Nevertheless, one of the computer measurement non-invasive methods for the dynamic processes diagnosis is the Electrical Capacitance Tomography (ECT). This technique delivers the two- and three-dimensional imaging in the basis of dielectric features of the process’ components, e.g. flow. The first ECT systems (Pląskowski A., Beck M.S., Thorn R., 1995; Reinecke and Mewes, 1996) allowed to obtain only the rough evaluation of the process state because the information encoded in measurement data represents merely the fragment of the process which additionally was approximated into the cross-section surface through the sensor (2D ECT) (Isaksen, 1996; Yang and Peng, 2003). Unfortunately, this kind of imaging occurred to be insufficient from the process control point of view. The cross-sectional image does not reflect enough the spatial phase distribution or flow structure in a measurement volume. It is because the image is generated according to the approximated measurement values from the whole electrodes surfaces. In the case of long electrodes, the high level of approximation prevents the precise measurements. Moreover, the spatial electrostatic field distribution is neglected. Therefore, the ECT diagnosis was developed in the direction of other data processing methods like cross-correlation (Mosorov et al., 2002), image processing and analysis, multi-layered tomography (Gadd et al., 1992; Holder, 2004; Metherall et al., 1996; Wang et al., 2003) etc. Nevertheless, independently of the mentioned extensions still the classic 2D ECT measurement suffered from the limitations of the cross-sectional approximation. Many of the industrial processes are characterized by the spatial features and their reduction to the planar solution results in undesirable simplifications.
The literature studies, I have conducted concerning existing research publications in the field of electrical capacitance tomography in 2006, allowed me to identify some unsolved problems and motivated me to the further exploration of this issue. Most of the research works based on the ECT technique have implemented the image reconstruction methods which suffer from the poor final quality. In the images (tomograms) it was impossible to distinguish the clear borders between the process components (phases) (Polydorides and Lionheart, 2002; Warsito and Fan, 2005, 2003; York et al., 2003). Nonetheless, in many industrial applications supported by the ECT diagnosis beside the accurate measurement devices a key role plays the data processing and image reconstruction methods. From these methods, it is expected the high image quality together with the short processing time. These challenges concern the essential computer issues like the image resolution enhancement saving quality and processing time what definitely results in the computation complexity, computer modelling of measurement sensors, numerical errors and finally in the necessity of development of new algorithms for efficient management of resources as well as computation power.
The issues mentioned above caused that my research area was mainly focused on the development of new computer methods for three-dimensional tomographic data processing and visualisation dedicated to non-invasive diagnosis and regulation of industrial flow processes. The results of conducted research, as well as the developed methods, help me to contribute the visualisation quality, fastness and the diagnosis precision enhancement to the computer science discipline and the ECT domain. The scope of my research covered the development, implementation and verification of:
- raw tomographic measurement data processing algorithms in the context of TPF diagnosis;
- computer methods for spatial ECT sensor modelling and designing;
- fuzzy inference algorithms for the TPFs type identification and regulation;
- software deploying the developed algorithms and methods for the purpose of real flow processes monitoring and regulation.
After obtaining my PhD degree, the main streams of my research I have conducted at the Institute of Applied Computer Science (IIS) at LUT have been as follows:
- algorithms for computer modelling and sensitivity analysis of three-dimensional ECT sensors for tomographic visualisation;
- computer methods for supporting the 3D ECT sensor designing process;
- identification and regulation of TPF type in the basis of fuzzy inference and tomographic diagnosis.
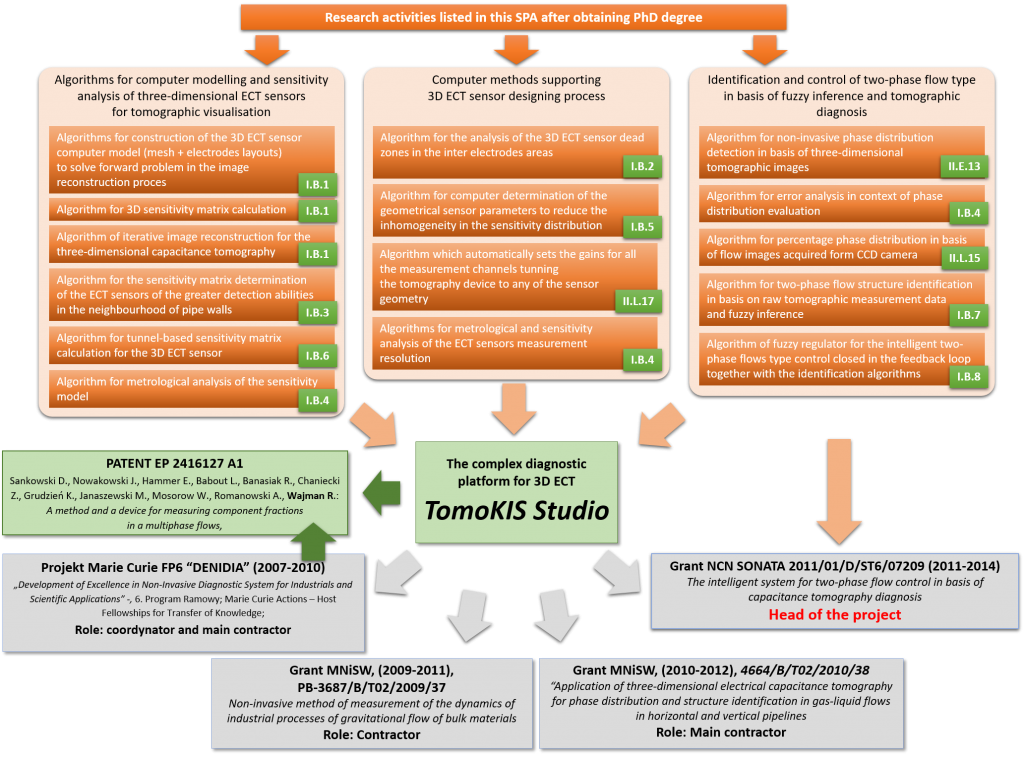
In figure 1 the algorithms, I designed after PhD degree, for the tomographic diagnosis and regulation of industrial two-phase gas-liquid flows were summarised in context of their usefulness within the most important research projects I take part in. The algorithms together with the references to the articles from the cycle were grouped regarding the main research streams.
Next, the discussion on the research results of my algorithms and computer methods is provided and it is divided into sections according to the main research streams listed above.
Algorithms for computer modelling and sensitivity analysis of three-dimensional ECT sensors for tomographic visualisation
In 2006 after obtaining my PhD degree I continued the research on computer methods for ECT sensor modelling. I finished then the project concerning the numerical implementation for 16 electrodes 3D ECT system together with the complete software for 3D ECT sensor simulation, 3D image reconstruction and visualisation. The obtained results I published in July 2006 in [Att. 3 pos. I.B.1].
My first research task was to develop and verify the algorithms for the construction of the 3D ECT sensor computer model and forward problem solution. This stage is responsible for the calculation of the electric field distribution preconditioned by the initial permittivity distribution inside the sensor and next for the inter-electrodes capacitances values calculation. Next, I developed two algorithms. The first one determines the spatial sensitivity matrices determination for 3D ECT sensor in the basis of obtained electric potentials values in the grid nodes (voxels). The algorithm for calculation of the inverse problem for three-dimensional image reconstruction, in turn, I developed in the basis of crucial modifications of 2D iterative algorithms. All mentioned algorithms I verified numerically and together with the results I published in [Att. 3 pos. I.B.1] and implemented using WINAPI C++ platform. The built software called “WinRECO” provided the tool for complete 3D ECT image reconstruction and was shared in the Process Tomography Laboratory at Institute of Applied Computer Science (IIS) for next research purposes where the 3D ECT system was used as a diagnostic module. More details concerning the practical application of my algorithms may be found in one of the last sub-chapter titled “Usefulness of the conducted research”. The diagnostic knowledge obtained thanks to the phase distribution visualisation in the form of 3D images had expanded the possibilities of applying the ECT systems in industrial processes.
Furthermore, in a frame of my early achievements in the ECT domain I developed the specialised sensitivity model for two-dimensional ECT sensor. In 2007 as the main executor I contributed to the research project MNiSW no PB‑1318/T10/2005/28 titled „Development of the measurement method for flow structures identification” supervised by Mariusz R. Rząsa PhD, DSc from Opole University of Technology. My task within this project was to develop a new image reconstruction method for the dedicated ECT system to enhance the spatial resolution and the detection abilities in the neighbourhood of pipe walls. The proposed solution assumed the new structure of the capacitance sensor which allowed the measurement of flow types characterised with the homogenous phase distribution along the pipeline and very small objects like bubbles or drops, e.g. churn, annular, slugs or plugs flows. The sensor allowed the diagnosis of the thin liquid layer in the area next to the pipe wall. The main characteristic feature of the sensor has been the extra electrodes with the width many times smaller than the measurement electrodes mounted between them. During the measurement, the extra electrodes adjacent to the measurement electrode have assigned the electric potential the same as the opposite electrode which participates in the measurement. As a result (Fig. 2b in [Att. 3 pos. I.B.3]) the measured capacitance value has been equal to the sum of three component capacitances. Because the extra and measurement electrodes have been next to each other, then considering the electric field distribution the highest sensitivity of the set has been in the area located near the pipe wall. Adjusting the width of the extra electrodes it has been possible to achieve the optimal attitude between the sensitivity in the sensor centre and in the neighbourhood of the wall. Next, having the designed sensor’s structure, I developed and implemented the image reconstruction method that in forward as well as in inverse problem considers the new sensor geometry. As a first step, I developed the algorithm for the sensor area discretisation. It considers the new sensor’s elements and also adjusts the grid density increasing the numerical accuracy only in the area next to the electrodes but simultaneously decreasing the influence of under-determining aspect of image reconstruction process (i.e. significantly larger number of image points (variables) than the number of measurement data). After that, I developed the algorithms for numerical calculations of the electric field potentials distribution and sensitivity matrices for the sensor with the greater detection abilities in the neighbourhood of pipe walls. In this case, the algorithms consider not only the sensor geometry but also the extra electrodes influence on the measurement. Therefore, for each measurement pair, the algorithm assigns the electric potential value to two associated extra electrodes. This feature limited the total number of measurement electrodes in the design tomographic device excluding thereby the possibility of spatial (3D) measurement. Nevertheless, as it was shown in [Att. 3 pos. I.B.3], the developed measurement system occurred to have the strengthened abilities to detect the structures of counterflow and thereby to give a more accurate tool for the description of this dynamic phenomena especially in the area of the pipeline wall.
One of the stages of the image reconstruction process for the 3D ECT is the sensitivity matrix determination. This matrix is the most important factor deciding about the final image quality. With the issue of sensitivity matrix for ECT I am conversant since my PhD research. Then, but for the 2D case, I developed the innovative algorithm for sensitivity matrix calculation along the electrical field lines and image reconstruction method which were the basis of the research described in the article (Loser, Wajman, Mewes, 2001). The work still enjoys the wide interest from the international research teams what may be proved by the total citations count equals to 69 (from Scopus base excluding self-citations) and within the last 4 years 13 times. The results of the research works I performed during my scientific internship in Hannover (Germany) I considered in my PhD thesis.
In work [Att. 3 pos. I.B.1], in turn, my contribution was to develop the method of the sensitivity matrix determination for the 3D ECT case. This method I developed and implemented mainly on the basis of energy field dependencies. It delivers, in most cases, approvable reconstruction results and also gives the possibility to iterate the process considering in each step the sensitivity matrix update adjusting it to the changing electrical field. However, in 2014 taking into account the still grooving quality diagnostic demands I designed the substantial modification of the method considering the electrical field distribution inside the sensor. Developed and implemented the tunnel-based algorithm determines the sensitivity matrix in each step of the image reconstruction process along the electrical field lines using the mathematical and physical dependences derived from the electrical field energy analysis. In [Att. 3 pos. I.B.6] it was shown that the new sensitivity maps more precisely reflect the non-linearity of the electrical field phenomena. According to the characteristic geometrical shape of the resulting maps, the method is called as tunnel-based. It assumes in fact that most of the deterministic image reconstruction methods, which use the sensitivity matrix, are derived from the linear tomography represented by the X-ray, gamma-ray or optical tomography. The applicability of the linear image reconstruction methods for the electrical tomography is conditioned by a suitable sensitivity matrix which the main task is to approximate the phenomena of the electrical field inside the ECT sensor. In the linear tomography, the sensitivity analysis is based on the calculation of the ray projection absorption factors in each point of the mesh. The electrical field lines, likewise, can be considered as rays projected in linear tomography. Following these lines in the space of 3D ECT sensor, the sensitivity tunnels can be constructed which reflect the voxel participation in the projection (i.e. electrical field lines are considering the permittivity [material density] distribution).
Furthermore, in work [Att. 3 pos. I.B.6] the results of my experiments may be found. There are both simulations as well as experiments conducted on the TPF facility in Tom Dyakowski Process Tomography Research Laboratory in IIS at LUT. To evaluate the measurement resolution and image reconstruction quality of 3D ECT sensors, I developed the complex numerical method. In a frame of it, I implemented the algorithm for metrological analysis of sensitivity model. For the image error estimation, I applied the following criteria: the normalised mean square error, the Pearson’s linear correlation coefficient. In each experiment, the achieved results proved the adequateness of assumptive solution in comparison to the traditional methods (based on the electrical field energy). The improvement in the convergence for the tunnel-based sensitivity matrix approach is noticeable. This feature is especially emphasised while increasing the belligerence (fastness) of the reconstruction process by increasing the relaxation factor. It is worth to mention that for the unduly high value of this factor the traditional method ultimately lost his convergence and the image errors kept rising in each step. The usage of the tunnel-based method is fruitful even in this case mapping the TPF structures on the tomograms in a correct way. Furthermore, this algorithm was successfully applied in a non-linear image reconstruction method. It was implemented in the diagnostic module for the two-phase gas-liquid flow identification system developed in frame of the research project MNiSW no 4664/B/T02/2010/38 titled “Application of three-dimensional electrical capacitance tomography for phase distribution and structure identification in gas-liquid flows in horizontal and vertical pipelines” supervised by Robert Banasiak PhD, DSc in the years 2010-2012.
The computer methods supporting 3D ECT sensor designing process
The task of design and fabrication the most efficient sensor structure from the mechanical and electrical point of view is relatively difficult (Zhang et al., 2014). The electrodes layout, their shapes and geometrical dimensions, horizontal and vertical gaps, the width of the inner-electrodes rings, boundary screens and finally the thickness of the isolation need to be determined according to the measuring sensitivity abilities of the measurement hardware unit and to dielectric properties of the diagnosed medium. Sensitivity of the ECT system requires the measured values and their changes to be above a certain minimum level. It enforces the use of electrodes with a sufficiently large surface area. In the case of ECT imaging technique measured capacitance range can varying from tens to hundreds of picofarads and a difference of capacitance caused by a change of dielectric permittivity distribution can be a range of femtofarads. Taking the above into consideration (whereas, e.g. the homogeneous sensitivity in the whole sensor volume is expected) the most important is to develop the mechanism for supporting the time-consuming task of sensor design under given conditions of its deployment for purposes of the industrial process diagnosis. These sensor’s parameters to be determined include a surface area of the electrodes and their shape, the inter-electrode horizontal and vertical spacing, width of the inter-electrode and boundary screen, also the thickness of protective insulation. Moreover, the development of analogous sensors’ concepts on pipes with different profile’s diameters and additionally to study liquids with different dielectric permittivity values is not a matter of simple geometry “rescaling”. The electric field is known to be highly non-linear, and the choice of ECT sensor geometry parameters must be also optimised experimentally by using ultra-precise LCR meter. During these experimental work, the inner space of the test sensor should be filled by the water (a medium of high dielectric constant) and the air (the medium of low dielectric constant). Then a static capacitances measurement by the RLC meter should be performed. The analysis of experimentally collected capacitance data allows for adjusting optimal key parameters of sensor design to an ECT tomography sensor measuring range.
One of my first research issue regarding the 3D ECT sensor design was the dead zones identification. In 2007 (Warsito et al., 2007) in a context of the article [Att. 3 pos. I.B.1] and the polemic with the research group from Ohio State University (Prof. Liang-Shih Fan) I developed the algorithm for the analysis of the 3D ECT sensor dead zones in the inter‑electrodes areas. The results were published in [Att. 3 pos. I.B.2]. It was pointed out that in published sensor structure the dead zones were significantly reduced and also, this sensor was characterised by the increased measurement resolution in comparison to the sensor offered by the Prof. Fan’s team (Warsito and Fan, 2003). The conclusions published together with the results of the experiments let to explain the doubts finally.
The methods developed in a frame of the mentioned issue allows me to develop the computer method for geometrical and mechanical 3D ECT sensors’ properties determination in the context of various applications. As part of this method, I developed a series of algorithms and implemented them in the WinRECO software, i.e. algorithms for 3D ECT model mesh generation, the algorithm for electrical field simulation, algorithms for metrological and sensitivity analysis of the sensor’s dead zones. Moreover, the method was used within the experiments carried out for two articles [Att. 3 pos. II.A.2] and [Att. 3 pos. II.A.3] purposes. I was there responsible for the ECT sensor design and fabrication as well as the ECT experimental setup implementation. Each time the application conditions were different therefore it was a need to evolve various sensors’ conceptions.
The research task described in [Att. 3 pos. II.A.2] aimed to evaluate the applicability level of the ECT systems to investigate the defects inside the dielectric materials. The mentioned 3D ECT sensor structure consisted of four electrodes’ rings. The electrodes in the following ring were shifted to these in the previous ring about 5o. Moreover, the central rings contained four electrodes more. Such approach brought about alignment in the homogeneity of the effective imaging area within the whole sensor volume and simultaneously allowed to reduce the number of electrical field intensity overloads next to the external edges of the sensor.
In a frame of the research described in [Att. 3 pos. II.A.3], which deals with the development of the image reconstruction algorithms for 3D ECT, the direct temporal image reconstruction method was applied as an alternative to the common 4D image reconstruction in the basis of the images sequence (the fourth dimension is the experiment time). The sensor construction contained the two central rings narrower than the external ones. It was because using my previous sensors the measured capacitances between electrodes from the central rings were significantly greater than others. For the dynamic processes, which are additionally indicated by the temporary and simultaneously huge disparities between the permittivity values for given fractions, it could be observed that the capacitances values within the measurement set frequently exceeded the level determined for the sensor totally filled with the fraction of the maximal permittivity value. This phenomenon causes that the applied ECT system produced the measurements values greater than the converter range distorting thereby the results of the experiments. Finally, the developed sensor structure under my concept allowed to collect the balanced measurement values set even for dynamic processes.
The industrial process, which I diagnosed, were characterised by the minor discrepancy in electrical permittivity between used materials. Together with air I applied the plastic granules (e.g. pcv, erthalon) as well as the rise or chipping (sand) [Att. 3 pos. II.L.9] and [Att. 3 pos. II.L.11]. However, quite distinct conditions I met constructing the system for the mentioned before research project 4664/B/T02/2010/38 where the two-phase gas-liquid mixtures were diagnosed. In this case, as a liquid, I use polypropylene glycol, carboxymethylcellulose as well as water which are indicated by significantly higher (even 80 times) relative electrical permittivity value in an attitude to air. Within many simulations I perform for the sensor I noticed the negligible penetration of the electric field in its centre especially in the case when the sensor volume with electrodes mounted externally on a pipe wall was completely filled with the liquid. Moreover, the analysis of the equipotential lines indicated that the electric field was unduly concentrated in the pipe’s wall made from PMMA with the relative permittivity significantly lower than the relative permittivity value of the used liquid. This phenomenon (which can be seen in figure 5a in [Att.5 pos. I.B.4]) did not occur in the case of the sensor with internal electrodes I developed for [Att. 3 pos. I.B.5] and [Att. 3 pos. II.E.16]. The experiments based on the sensitivity analysis proved, that the new construction for the same liquids allowed to achieve the effect of deeper penetration of the electric field throughout the process. In a frame of this task, I developed and implemented the algorithm for computer determination of the geometrical sensor parameters to reduce the inhomogeneity in the sensitivity distribution which effectively allowed to adjust the proper sensor geometry together with the spatial electrodes layout under the process conditions (extreme big relative electrical permittivity values). In the basis of the method, I was able to design a suitable sensor. The experiments results published in [Att. 3 pos. I.B.5] proved the better applicability of the sensor for liquid flow processes.
In the IIS for the 3D ECT research purposes, the TomoKIS team (i.e. the group of researchers in the Institute dealing with the tomography diagnosis) uses the ET3 tomography device fabricated by the team of Dr Roman Szabatin from the Institute of Radioelectonics at Warsaw University of Technology (Brzeski et al., 2003). From the industry point of view, the most desirable feature of this device is the possibility of freely adjusting the gains of the measurements circuits for each measurement electrodes pair separately. Therefore, this device is universal of use and can be applied for diagnosis of various processes. In case of 32‑electrodes sensor, there are 496 measurement chains controlled by four parameters which prejudging about the stability as well as the amplitude of the signal what finally determines the SNR (signal-to-noise ratio) of the measurements. There are two amplifiers (4 values of setting for each) and feedback resistors and capacitors (it gives together 12 values of settings). Such diversity of settings caused that the manual tuning of the device is very time-consuming. Simultaneously, there is very important to tune the system as precisely as possible remembering that despite the big and different distances between electrodes and the different sensor geometry the small measurement capacitances should oscillate in the measurement range of the device and additionally should be sensitive enough to the changes of the permittivity distribution between full and empty sensor. Taking the above into consideration, I developed and implemented the method which automatically sets the gains for all the measurement channels based on the user conditions and calibrates the tomography device to any sensor geometry [Att. 3 pos. II.L.17]. The method was verified by the TomoKIS team by numerous experiments adjusting the ET3 to the different industrial processes and sensors (i.a. [Att. 3 pos. II.L.11], [Att. 3 pos. II.L.13] and [Att. 3 pos. II.L.14]).
During my multiannual research works, I had the possibility to meet various conditions of the 3D ECT application for industrial processes. Each time the most desirable issue was to construct the special sensor structure to increase the measurement resolution as well as to amplify its sensitivity, especially in its specified areas. To validate the parameters, which unambiguously may decide about the usefulness of the sensor to the given process, in 2013 in a frame of the research project (4664/B/T02/2010/38) I developed the set of algorithms for metrological and sensitivity analysis of the ECT sensors in context of gas-liquid flows diagnosis [Att. 3 pos. I.B.4]. According to this task, I performed the numerical analysis of the sensitivity distribution of the designed 3D ECT sensors to evaluate their measurement resolution. It is worth to note that the simulation effectively supported the process of optimal sensor geometry construction under the homogeneity measurement condition for flows with the liquids of high permittivity value.
Identification and regulation of two-phase flow type in the basis of fuzzy inference and tomographic diagnosis
In many industrial applications for TPFs it is important to provide the diagnostic signals which simultaneously allow to identify the materials behaviour (qualitative) and to measure the characteristic features of the dynamic flow (quantitative) in real time. The TPFs (liquid/liquid, gas/liquid) needs and demands include efficient monitoring as well as an automatic regulation. The computer measurement systems based on video signals analysis and processing in comparison to the classic measurement devices are featured by two main advantages which allow to face up to these demands. Definitely in a better way they can illustrate the physical and chemical phenomena (in space and in time) in the industrial process what next allows to develop more efficient methods for control and diagnosis.
My contribution to this area was to develop and verify the algorithm for non-invasive phase distribution detection in the basis of three-dimensional tomographic images [Att. 3 pos. II.E.13]. This algorithm was an innovative solution in case of regulation and diagnosis of two-phase gas-liquid mixtures flows. The concept based on 3D flows tomograms analysis and processing like image segmentation (not yet artificial intelligence techniques) and as a result, the percentage value of phase distribution in the sensor volume was determined. Apart from this, the developed software was constructing the 3D images distinguishing the liquid fraction. Afterwards, I developed the algorithm for error analysis in the context of phase distribution evaluation and published it in [Att. 3 pos. I.B.4]. To verify the results, I also designed the algorithm for percentage phase distribution in the basis of flow images acquired form CCD camera [Att. 3 pos. II.L.15].
The achievement within the mentioned research became an inspiration for me to search for new solutions in respect to an improvement in flow diagnosis. The growing needs of industry for a versatile, relatively inexpensive, non-invasive and rapid method of TPFs regulation and diagnosis justify the importance of the continued research topic. In addition, the literature studies, I have conducted concerning existing (in 2010) research publications in this field, let me state that there was a lack of the intelligent diagnosis and regulation methods dedicated for the two-phase flows supported with the 3D ECT non-invasive monitoring.
In the years 2011 – 2014 I supervised the research project SONATA no 2011/01/D/ST6/07209 titled “The intelligent system for two-phase flow control in basis of capacitance tomography diagnosis” founded by National Science Centre which has been positively evaluated. The main goal was to develop the intelligent diagnostic and control system for monitoring and automatic control the two-phase gas-liquid mixtures flows processes in the horizontal and vertical pipelines. The diagnostic signals obtained in a frame of fuzzy inference allowed me to design the methods for the spatial flow characteristic identification, flow maps determination and analysis. This, in turn, was the input signal to another algorithm for flow process regulation and provided the complex knowledge about the current state of this process. I applied the fuzzy inference and as the input, I used the raw measurement data. Thanks to the 3D ECT it has been possible the real-time, non-invasive diagnosis and monitoring of the pipeline interior. The essence of my research task was to develop the methods based on fuzzy clusterisation and on spatial relations analysis for the flow structures shapes and localisation determination directly from raw data (not images) and for regulation of this flow process. It has been an innovative approach not encountered before in scientific resources. Ultimately, the developed algorithms and methods were deployed to the two-phase gas-liquid mixtures flow facility of a half-industrial scale and closed in a feedback loop.
The culmination of my project is the intelligent diagnostic and regulation system named intelliFlowControl able to the comprehensive evaluation of the flow behaviour in the basis of 3D tomography measurements and able to produce the control signals to maintain the process under given conditions. The system supports the research facility entirely in Tom Dyakowski Process Tomography Laboratory in the IIS at LUT. Furthermore, in September of 2015, I applied to the Polish Patent Office for the protection of the invention titled “Fuzzy regulator for two-phase flow type control”. The application numbered P.413804 has just been published. The added value of the system is its commercialisation potential. The invention was doubly awarded on International Inventions Shows and presented as well for wide industrial representants group (Azoty Włocławek, Orlen S.A., National Instruments, etc.) and is the part of the industrial offer of Lodz University of Technology (LUT).
The core of the intelliFlowControl system consists of two algorithms:
- for TPF structure identification in basis on raw tomographic measurement data and fuzzy inference,
- of fuzzy regulator for the intelligent TPFs type regulation closed in the feedback loop together with the identification algorithms.
The first stage of the fuzzy identification algorithm [Att. 3 pos. I.B.7] is the fuzzy clusterisation FCE (Fuzzy c-elliptotypes) responsible for a description of the typical flow structures like slugs and plugs. The results of the clusterisation block together with the results of the raw data analysis are input to the main flow identification block, which uses the algorithm for the current flow state determination in the basis of both inter-object spatial relations’ map as well as the fuzzy evaluation of these relations (Zadeh, 1999). The obtained map, which considers the mutual location, size and shape of the structures, is finally applied in the matching process of the patterns as a vector of characteristic features of the flow. These patterns are previously determined experimentally. Furthermore, this map, in turn, is useful for producing other flow maps dependent on the pipeline and the medium. The determined flow maps are important as a pattern for control relations and current flow state.
My concept for the identification algorithm has been based on row (not images) 3D tomographic measurement data obtained from the sensor located on the examined part of the pipeline and on this direct data analysis as well as on the identification of the flow structures’ shapes. Next, the result of identification is used to conclude on flow type [Att. 3 pos. I.B.7]. The usage of raw data in case of flow structures recognition becomes an effective (qualitative but also in the meaning of processing time) modification of the method developed in 2012 in a frame of the research project no 4664/B/T02/2010/38 supervised by dr hab. inż. Robert Banasiak, I took part in. This method based on reconstructed three‑dimensional tomographic images and on sophisticated parallel GPU computing algorithms. Despite acceptable results I noticed that during its work there was a risk to discount (not to detect) some characteristic flow features like slugs or plugs which (highly dynamic) are essential in the TPF identification process. The significant part of diagnostic information is able to be directly obtained on the stage of raw data analysis just before the image reconstruction. Such analysis decreases the risk of missing the crucial knowledge like gentle bubbles which become invisible after image reconstruction. The raw data processing is related to the significant increase of total measurements samples because the real-time image reconstruction process is time-consuming. Therefore, the flow type evaluation is possible in a real-time mode without the need of application of expensive computer hardware equipped with numerous efficient graphics cards and parallel GPU computing algorithms. Moreover, the processing time is limited only by the measurements capability of ECT system hardware (the mentioned ET3 device can provide 12 complete measurements frames per second for 32 electrode sensor). The solution I evolved simplifies the implementation and finally mitigates the total system costs.
The research on the fuzzy identification algorithm I conducted as a supervisor of the research team I established within my project. The PhD student mgr inż. Paweł Fiderek was one of the team members. I act as an assistant supervisor of his PhD thesis (supervisor dr hab. inż. Jacek Kucharski, prof. of LUT). Together with PhD student, I developed the fuzzy inference algorithm which is based on the statistical flow features and neglects thereby the patterns’ set and refuses the requirement of the knowledge base determination. It is worth to note that the innovative shape of membership functions was introduced. The sections of the trapezoids functions’ sides (legs) are constructed in the basis of exponential functions. Thanks to this the non-crisp nature of the border between any of the TPFs types is reflected more accurately and is better customizable (only by a single parameter) to the subjective assessment of the user.
The identification algorithm allows the non-intrusive and non-invasive flow monitoring in a real-time mode providing the accurate flow dynamic analysis, determining the flow types and warning against undesirable states. Moreover, one of the algorithm’s attributes is its usefulness for the new flow maps determination. One of the examined liquid was the propylene glycol. It is a highly hygroscopic liquid which attracting and holding water molecules from the surrounding environment changes its physical parameters. Furthermore, because of its low value of surface tension, glycol is a liquid vulnerable to foaming during the flow what affects the instability of flow structures and the lack of reproducibility of flow character under the same conditions and in the short time intervals. Admittedly, this feature is important in case of various applications where there is a need either to reclaim the moisture excess or to heat exchange in heating devices. But additionally, this feature makes that this liquid suffers from lack of unambiguous flow maps (Parsi et al., 2015; van Nimwegen et al., 2015). The mentioned identification algorithms occurred to be helpful by construction such maps i.a. for facilities in the Process Tomography Laboratory. These maps consider the acceptable measurement range of gas and liquid streams powering the flow rig. This transpired to be important especially in the case of horizontal sections of the pipeline. The determined flow maps differ significantly from these commonly used so far e.g. in the border area between a slug and plug flow [fig 1. in the article (Att. 3 pos. I.B.7)].
Furthermore, from the industrial point of view the diagnostic task is crucial because, in spite of the appropriate flow type identification, the algorithm shares the mechanism of malfunctioning detection which could and frequently does affect the process hold-up, worse quality of the final product or even the emergency states like accidents or disasters. An algorithm is thus an efficient tool for undesirable states detection.
The algorithm for two-phase flow facility control described in [Att. 3 pos. I.B.8] uses in turn knowledge about the objects and their spatial relations to work in a closed feedback loop. This module allows to set the flow type in a special part of the pipeline and to evaluate the impact of the noisy factors (i.e. rapid pressure changes, emergency) on the process behaviour. The algorithm is based on the fuzzy inference techniques, therefore, makes a decision about the control strategy. The fundamental analysis of the world literature, performed by me in 2010, let me state that at the time there was a lack of similar computer methods which would be able to regulate the flow type in the basis of the tomographic diagnosis and fuzzy inference.
In the algorithm, the safety technique was implemented. It has two tasks. First, it conducts the observation of the current state of the flow to detect undesirable states. Second, the analysis of the current diagnostic signals to predict the emergency and to avoid such situations.
The algorithm for two-phase flow facility control is characterised by the short response time but also by its universality of application. It is dedicated for various TPF processes which require precise and effective regulation. The mentioned precision was achieved thanks to the decomposition of the input signals into two classes. The classic fuzzyfication was not applied here because the input consists of two fuzzified relations (i.e. current and given flow type) and two fuzzified variables (i.e. values of gas and liquid streams). Similar to the identification algorithms the same membership functions were applied to more precisely reflect the non-crisp borders between flow types. Therefore, one of the features is the possibility of changing the required flow type changing only the value of one parameter. This is performed within the most effective range of the powering devices avoiding their overloads, saving lifespan and decreasing any additional maintenance costs. Moreover, this functionality is responsible for the regulator protection against the over-loop state in the case when the algorithm would try to reach the unsupported or undesirable flow type.
Finally, it is worth to mention the simple deployment. This may be performed by the maintenance staff of the flow rig and is guaranteed by sharing the individual sets of parameters and the intuitive inference rules. The main research task was intensified towards the automatic adjustment of the shape and number of membership functions of the regulator both input and output. Therefore, it is not required to determine any of complicated computer models of the flow rig, what is unfortunately necessary when using the classic regulators. The developed solutions allowed me to design the intelligent Black-Box type regulator dedicated to regulate the two-phase gas-liquid mixtures flows.
Usefulness of the conducted research
The crucial aspect of the mentioned research area is the practical deployment of my novel computer methods and algorithms into the real processes. The first issue is developed in 2009 the complex software for monitoring the TPF rig. This research I conducted in cooperation with the team from the Opole University of Technology consisted of increasing the abilities of the ECT system diagnosis by the sensor wall for vertical counter flows – the research project 1318/T10/2005/28 titled “Development of the measurement method for two-phase gas-liquid flow structures identifications”. In a frame of this project, I modified and shared the WinRECO computer program implementing the specialised methods for raw measurement data and cross-sectional images analysis.
In the years 2006 – 2010 I took part as research as well as an administrative fellow in the international 6FP Marie-Curie scientific-research project DENIDIA. In addition, I was responsible for the preparation of the proposal as well as further maintenance and report preparation for other domestic project founded by Polish MNiSW which aimed to support DENIDIA. I developed the computer methods which contributed to the achievement of the main DENIDIA project’s objectives (actions), i.e. improvement of ECT systems spatial resolution, measurement data acquisition, image reconstruction and visualisation saving the main advantage of ECT – measurement speed. The algorithms I developed supported: the control and synchronisation of the rotatable ECT sensor [Att. 3 pos. II.L.14], the image reconstruction process in dual-mode capacitance – resistance [Att. 3 pos. II.L.8] for the sensor dedicated for multi-phase flow processes visualisation [Att. 3 pos. II.E.14] [Att. 3 pos. II.E.15]. My contribution to this second task allowed to develop the multimodal measurement system (Gamma, ECT, ERT). The innovative solutions applied in the sensor are now protected with the European patent I am a co-author.
It is also important to point out that one of the major achievements of the DENIDIA project is the Tom Dyakowski Process Tomography Laboratory at IIS at LUT. I was actively involved in the design, organisational and finally in constructional tasks. The laboratory consists of three facilities for multiphase flow processes non-invasive examination. In order to ensure the similar conditions as in case of real industrial processes, the laboratory stands are built in a semi-industrial scale.
In 2011 together with dr hab. inż. Robert Banasiak I completed development of the software name TomoKISStudio [Att. 3 pos. II.L.17]. The built platform is a complex tool dedicated to electrical process tomography systems and makes the basic diagnostic software in the process tomography laboratory. Within this software I am the only author of algorithms responsible for:
- the tomographic devices communication and configuration,
- the computer method of automatic calibration of the tomography configuration parameters to adjust the 3D sensor to the process conditions considering the examined medium, various sensor geometry and the measurement values to fit them into the measurement range of the device and simultaneously to produce the significant difference in measurement for the empty and full sensor,
- 3D ECT and ERT computer model determination including the generators of finite elements mesh, 3D electrodes layout, spatial electrical potentials and sensitivity distribution [Att. 3 pos. II.E.12],
- the sensitivity tunnel-based model determination,
- the tomographic images reconstruction in dual (capacitance-resistance) mode (algorithm developed for DENIDIA purposes),
- the control and synchronisation of the rotatable capacitance sensor (algorithm developed for DENIDIA purposes),
- the tomographic measurement data transmission via the Internet network for the remote diagnostic in the different (often distant) measurement sections,
- the flow analysis in the basis of reconstructed images to produce the percentage phase distribution [Att. 3 pos. II.E.13],
- the graphical user interface, multithreaded and multimodal software structure.
The developed TomoKISStudio software supported with my algorithms for tunnel-based sensitivity modelling and maps determination was applied i.a. for diagnostic of silos discharging process in a frame of the research project no PB-3687/B/T02/2009/37 titles “Non-invasive method of measurement of the dynamics of industrial processes of gravitational flow of bulk materials” supervised by dr inż. Krzysztof Grudzień. Results obtained from the software allow determining the sensitivity matrices necessary for 3D imaging of the TPF of silo discharging. The results were helpful in the further research on particle flow monitoring [Att. 3 pos. II.L.11]. The research was conduct in cooperation with dr hab. inż. Maciej Niedostatkiewicz from the Gdańsk University of Technology. The verification was made on a real silos model, built in the laboratory of the IIS at LUT. Additionally, I am a co-author of the article which in the basis of my algorithms and TomoKISStudio describes the developed and implemented solutions for the online three-dimensional imaging of the gravitational flow in silo both statically and during discharging [Att. 3 pos. II.E.9]. These solutions were exhibited on international inventions shows winning numerous prizes and medals.
Summary
The main areas of the research I have conducted in the IIS at LUT after obtaining a PhD degree focused on the development of computer methods for three-dimensional tomographic data visualisation and processing for purposes of industrial flow processes non-invasive diagnosis and regulation. My most important achievements have been listed below which provide my contribution to the computer science research area:
- the algorithm for image reconstruction process for the three-dimensional capacitance tomography including the 3D sensitivity matrix calculation algorithm, iterative 3D image reconstruction algorithm [Att. 3 pos. I.B.1],
- the algorithm for identification of the dead zones in the 3D capacitance sensor inter-electrodes areas [Att. 3 pos. I.B.2],
- the algorithm for geometrical and mechanical properties determination for 3D ECT sensors to reduce the inhomogeneity in the sensitivity distribution [Att. 3 pos. I.B.3], [Att. 3 pos. I.B.4], [Att. 3 pos. I.B.5],
- the algorithm for the sensitivity matrix determination dedicated to counter flows diagnosis and for the ECT sensors characterized by the greater detection abilities in the neighbourhood of pipe walls [Att. 3 pos. I.B.3],
- the algorithm for tunnel-based sensitivity matrix calculation for the 3D ECT sensor [Att. 3 pos. I.B.6],
- the algorithm for metrological analysis of the sensitivity model [Att. 3 pos. I.B.4],
- the algorithm for percentage phases distribution calculation of TPF in the basis of 3D ECT images [Att. 3 pos. II.E.13],
- the algorithm for two-phase flow structures identification in the basis of raw tomographic data and fuzzy inference [Att. 3 pos. I.B.7],
- the algorithm for two-phase flow type control closed in the feedback loop with the identification algorithm [Att. 3 pos. I.B.8].
The methods I developed are characterised by significant usefulness and commercial potential. The algorithms designed to the 3D ECT systems expand this diagnostic technique’s abilities through increasing its application scope for industrial processes. The inference methods, in turn, designed to the purposes of TPFs diagnosis and control supported by the ECT system open the new possibilities for industrial solutions. Simultaneously, the wide area of flows processes’ exploitation causes that my computer methods can be used for optimisation of many industrial processes as well as to warn against unexpected failures or even industrial disasters. A crucial element of my research was an experimental verification of the methods and solutions proposed on the basis of semi-industrial installations of pneumatic transport, a TPF and a gravitational flow while silo discharging.
The research tasks I conducted are strictly IT solutions and contribute to the computer science area. The algorithms and methods pertain to the computer techniques of modelling, image reconstruction, visualisation, analysis and processing. The scope of my last research was related to artificial intelligence techniques. I developed new solutions in the area of fuzzy clustering, of defining fuzzy linguistic variables for TPFs purposes. This, admittedly, extends the world state of the art in case of AI industrial applicability. Moreover, this research tasks on intelligent techniques had an effect of new statistical data and signal processing methods and in the case of algorithmics upgraded the electrical field simulation for 3D ECT using finite elements method. The innovative intelligent fuzzy regulator shares the contribution into the industrial automatic control and computer sciences discipline. The usage of the regulator allows to automate the production line providing the mechanism of failure prevention or safety.
Other scientific and research achievements
Since 2006 I took part in various research works which were not connected with the presented in the previous section my academic achievement.
In the years 2008 – 2011 I took part as a research fellow in a scientific-research project entitled “An autonomous military robot designed for reconnaissance and mine detection” no. 0010/1/R/T00/2008/05. The aim of the research, conducted in cooperation with the Prexer company was to test the possibilities of detection of explosives in the ground by means of an electrical capacitance tomography system. Within the framework of the research with the use of reference materials (sand and wood), I undertook, along with the TomoKIS team, an attempt to assess a relative value of electrical permittivity of the pyrotechnic materials studied. The conducted studies have demonstrated that it is possible to detect a specific class of explosive materials, non-sensitive to an electric field environment, using electrical capacitance tomography.
In a frame of the DENIDIA project in IIS in 2010, I developed the method and the device for fractions measurement of the multiphase flow especially fractions of water, oil and gas of flows in the oil platform pipelines [Att. 3 pos. II.E.14] i [Att. 3 pos. II.E.15]. The essence of this innovation protected since 27.02.2015 by the European patent no EP-2416127 is the application of three tomographic modules (EIT/ECT/GRT) within one sensor and development of the computer methods for data aggregation. My contribution in it was to develop and implement the algorithms for electrical tomography diagnosis i.a. the algorithm for capacitance and resistance tomography synchronisation and calibration, the algorithm of image reconstruction of capacitance and resistance modules as well as these images aggregation algorithm.
I am also an inventor of two components of intelliFlowControl system, not mentioned so far, which de facto do not belong to my academic achievements but admittedly extend the system industrial proposal. First of them is the algorithm for timestamp distribution service to synchronise the measurement data obtained from various devices with different acquisition frequency [Att. 3 pos. II.E.19]. Two capacitances tomography systems, CCD camera as well as numerous measurement devices in the flow rig like gasometers, flow meters and barometers were synchronised. Each of the programs for collecting the measurement data received the timestamps provided in the basis of time determined by one of the computers and assigned them to every measurement value. This solution was definitely helpful while further analysis as well as while metrological validation of the complete system. The second component is the mobile touchable panel for system model visualisation, its current state monitoring supported by the graphical user interface for programming own flow rig models. I developed the method for presenting the current state of all strategic parts (elements) of the flow rig. Using the “touchable gesture” (common mobile devices feature), it is possible to regulate the process from the tablet or phone. It is possible to change the pipeline, flow type or separate set of power devices. Furthermore, this solution thanks to the shared self-programmable features allows creating some new extended elements for visualisation, monitoring and control. These issues, mentioned above, make an alternative to expensive commercial industrial visualisation systems.
My experience in the field of 3D ECT systems occurred to be helpful in the case of two different research tasks published in the journals from the Thomson Reuters JCR list: [Att. 3 pos. I.A.1] and [Att. 3 pos. I.A.4] which I am a co-author. In case of both articles, I was responsible for the design of the experimental setup which consisted of the measurement 3D ECT system and measurement data acquisition module. My duties included as well the experiments conducting.
Finally, in 2017 I was invited to be the co-supervisor of one of the PhD student in a frame of the Marie Skłodowska-Curie European Innovative Network (HORYZONT 2020) “Smart tomographic sensors for advanced industrial process control (TOMOCON)” which joins 12 international academic institutions and 15 industry partners, who work together in the emerging field of industrial process control using smart tomographic sensors. Since 2017 I am responsible for one of 15 research tasks titled “ERT tomography for measuring the crystallization progress in a batch reactor”, and I am an assistant supervisor of one PhD student Guruprasad Rao.
Additionally, my experience and research achievements in the field of electrical process tomography computer methods appeared to be useful for two research projects’ purposes I am actively involved in. Both projects started in 2017 and are funded by polish National Centre of Research and Development institution and will be conducted in cooperation with the NETRIX research and development company from Lublin. The first project (acronym LETS) deals with the problem of innovative application of process tomography systems for the purpose of an area imaging and monitoring using potentials nodes map. Next project aims to develop “The new generation of industrial tomography platform for diagnostics and process control” – PLATOM.
Bibliography
- Abbagoni, B.M., Yeung, H., 2016. Non-invasive classification of gas-liquid two-phase horizontal flow regimes using an ultrasonic Doppler sensor and a neural network. Meas. Sci. Technol. 27, 84002. doi:10.1088/0957-0233/27/8/084002
- Abdulmouti, H., 2015. Bubbly Two-Phase Flow: Part II- Characteristics and Parameters. Am. J. Fluid Dyn. 4, 115–180. doi:10.5923/j.ajfd.20140404.01
- Akita, K., Okazaki, T., Koyama, H., 1988. Gas holdups and friction factors of gas-liquid two-phase flow in an air-lift bubble column. J. Chem. Eng. Japan 21, 476–482. doi:10.1252/jcej.21.476
- Arvoh, B.K., Hoffmann, R., Halstensen, M., 2012. Estimation of volume fractions and flow regime identification in multiphase flow based on gamma measurements and multivariate calibration. Flow Meas. Instrum. 23, 56–65. doi:10.1016/j.flowmeasinst.2011.11.002
- Balamurugan, S., Lad, M.D., Gaikar, V.G., Patwardhan, A.W., 2007. Hydrodynamics and mass transfer characteristics of gas–liquid ejectors. Chem. Eng. J. 131, 83–103. doi:10.1016/j.cej.2006.12.026
- Bertola, V., 2003. Two-Phase Flow Measurement Techniques. Springer Vienna, pp. 281–323. doi:10.1007/978-3-7091-2538-0_6
- Beux, S., Nunes, E., Barana, A.C., 2007. Effect of temperature on two-phase anaerobic reactors treating slaughterhouse wastewater. Brazilian Arch. Biol. Technol. 50, 1061–1072. doi:10.1590/S1516-89132007000700017
- Blažej, M., Cartland Glover, G.M., Generalis, S.C., Markoš, J., 2004. Gas–liquid simulation of an airlift bubble column reactor. Chem. Eng. Process. Process Intensif. 43, 137–144. doi:10.1016/S0255-2701(03)00010-2
- Brebbia, C. a., Mammol, a. a., 2011. Computational Methods in Multiphase Flow VI.
- Brzeski, P., Mirkowski, J., Olszewski, T., Pląsowski, A., Smolik, W., Szabatin, R., 2003. Multichannel capacitance tomograph for dynamic process imaging. Opto-Electronics Rev. 11, 175–180.
- Cheng, L., Ribatski, G., Thome, J.R., 2008. Two-Phase Flow Patterns and Flow-Pattern Maps: Fundamentals and Applications. Appl. Mech. Rev. 61, 50802. doi:10.1115/1.2955990
- Delnoij, E., Kuipers, J.A.., van Swaaij, W.P.., Westerweel, J., 2000. Measurement of gas?liquid two-phase flow in bubble columns using ensemble correlation PIV. Chem. Eng. Sci. 55, 3385–3395. doi:10.1016/S0009-2509(99)00595-3
- Dziubinski, M., Fidos, H., Sosno, M., 2004. The flow pattern map of a two-phase non-Newtonian liquid–gas flow in the vertical pipe. Int. J. Multiph. Flow 30, 551–563. doi:10.1016/j.ijmultiphaseflow.2004.04.005
- Fang Dong, Li-De Fang, Hong-Lian Li, Yan Zhu, 2012. Characterization of gas-liquid two-phase flow pattern based on complexity measures analysis, in: 2012 International Conference on Machine Learning and Cybernetics. IEEE, pp. 996–1000. doi:10.1109/ICMLC.2012.6359490
- Gadd, R., Vinther, F., Record, P.M., Rolfe, P., 1992. Reconstruction of three-dimensional data for electrical impedance tomography. Electron. Lett. 28, 974–976. doi:10.1049/el:19920619
- Guo, X., Zhou, X., Chen, Q., Liu, J., 2013. Flow field and dissolved oxygen distributions in the outer channel of the Orbal oxidation ditch by monitor and CFD simulation. J. Environ. Sci. (China) 25, 645–51.
- Holder, D.S., 2004. Electrical Impedance Tomography: Methods, History and Applications. CRC Press. doi:10.1118/1.1995712
- Isaksen, Ø., 1996. A review of reconstruction techniques for capacitance tomography. Meas. Sci. Technol. 7, 325–337. doi:10.1088/0957-0233/7/3/013
- Jothiprakash, V., Bhosekar, V.V., Deolalikar, P.B., 2015. Flow characteristics of orifice spillway aerator: numerical model studies. ISH J. Hydraul. Eng. 21, 216–230. doi:10.1080/09715010.2015.1007093
- Kassab, S.Z., Kandil, H.A., Warda, H.A., Ahmed, W.H., 2009. Air-lift pumps characteristics under two-phase flow conditions. Int. J. Heat Fluid Flow 30, 88–98. doi:10.1016/j.ijheatfluidflow.2008.09.002
- Kiambi, S.L., Kiriamiti, H.K., Kumar, A., 2011. Characterization of two phase flows in chemical engineering reactors. Flow Meas. Instrum. 22, 265–271. doi:10.1016/j.flowmeasinst.2011.03.006
- Lafmejani, S.S., Olesen, A.C., Kær, S.K., 2017. VOF modelling of gas–liquid flow in PEM water electrolysis cell micro-channels. Int. J. Hydrogen Energy. doi:10.1016/j.ijhydene.2017.05.079
- Liu, Y., Wang, L., Zhu, Z., 2015. Numerical study on flow characteristics of rotor pumps including cavitation. Proc. Inst. Mech. Eng. Part C J. Mech. Eng. Sci. 229, 2626–2638. doi:10.1177/0954406214562634
- Loser, T., Wajman, R., Mewes, D., 2001. Electrical capacitance tomography: image reconstruction along electrical field lines. Meas. Sci. Technol. 12, 1083. doi:10.1088/0957-0233/12/8/314
- Malijevsky, A., Archer, A.J., 2013. Sedimentation of a two-dimensional colloidal mixture exhibiting liquid-liquid and gas-liquid phase separation: A dynamical density functional theory study. J. Chem. Phys. 139, 144901. doi:10.1063/1.4823768
- Metherall, P., Barber, D.C., Smallwood, R.H., Brown, B.H., 1996. Three-dimensional electrical impedance tomography. Nature 380, 509–512. doi:10.1038/380509a0
- Mewes, D., Wiemann, D., 2003. Two-Phase Flow with Mass Transfer in Bubble Columns. Chem. Eng. Technol. 26, 862–868. doi:10.1002/ceat.200300009
- Mokhatab, S., 2008. Two-Phase Flow: Theory and Applications, 1st Edition Clement Kleinstreuer Taylor & Francis Group, Published May 2003, 454 pages ISBN: 1591690005. Can. J. Chem. Eng. 84, 260–261. doi:10.1002/cjce.5450840214
- Mosorov, V., Sankowski, D., Mazurkiewicz, ?, Dyakowski, T., 2002. The “best-correlated pixels” method for solid mass flow measurements using electrical capacitance tomography. Meas. Sci. Technol. 13, 1810–1814. doi:10.1088/0957-0233/13/12/302
- Olesen, A.C., Romer, C., Kaer, S.K., 2016. A numerical study of the gas-liquid, two-phase flow maldistribution in the anode of a high pressure PEM water electrolysis cell. Int. J. Hydrogen Energy 41, 52–68. doi:10.1016/j.ijhydene.2015.09.140
- Ozbayoglu, E.M., Ozbayoglu, M.A., 2009. Estimating Flow Patterns and Frictional Pressure Losses of Two-Phase Fluids in Horizontal Wellbores Using Artificial Neural Networks. Pet. Sci. Technol. 27, 135–149. doi:10.1080/10916460701700203
- Parsi, M., Vieira, R.E., Torres, C.F., Kesana, N.R., McLaury, B.S., Shirazi, S.A., Schleicher, E., Hampel, U., 2015. On the effect of liquid viscosity on interfacial structures within churn flow: Experimental study using wire mesh sensor. Chem. Eng. Sci. 130, 221–238. doi:10.1016/J.CES.2015.03.033
- Pląskowski A., Beck M.S., Thorn R., D.T., 1995. Imaging Industrial Flows – Applications of Electrical Process Tomography. IOP Publishing, Bristol.
- Polydorides, N., Lionheart, W.R.B., 2002. A Matlab toolkit for three-dimensional electrical impedance tomography: a contribution to the Electrical Impedance and Diffuse Optical Reconstruction Software project. Meas. Sci. Technol. 13, 1871–1883. doi:10.1088/0957-0233/13/12/310
- Reinecke, N., Mewes, D., 1996. Recent developments and industrial/research applications of capacitance tomography. Meas. Sci. Technol. 7, 233–246. doi:10.1088/0957-0233/7/3/004
- Ruspini, L.C., Marcel, C.P., Clausse, A., 2014. Two-phase flow instabilities: A review. Int. J. Heat Mass Transf. 71, 521–548. doi:10.1016/j.ijheatmasstransfer.2013.12.047
- Solotych, V., Lee, D., Kim, J., Amalfi, R.L., Thome, J.R., 2016. Boiling heat transfer and two-phase pressure drops within compact plate heat exchangers: Experiments and flow visualizations. Int. J. Heat Mass Transf. 94, 239–253. doi:10.1016/j.ijheatmasstransfer.2015.11.037
- Teng, P., Yang, J., Pfister, M., 2016. Studies of Two-Phase Flow at a Chute Aerator with Experiments and CFD Modelling. Model. Simul. Eng. 2016, 1–11. doi:10.1155/2016/4729128
- Vadlakonda, B., Mangadoddy, N., 2017. Hydrodynamic study of two phase flow of column flotation using electrical resistance tomography and pressure probe techniques. Sep. Purif. Technol. 184, 168–187. doi:10.1016/j.seppur.2017.04.029
- van Nimwegen, A.T., Portela, L.M., Henkes, R.A.W.M., 2015. The effect of surfactants on air–water annular and churn flow in vertical pipes. Part 1: Morphology of the air–water interface. Int. J. Multiph. Flow 71, 133–145. doi:10.1016/J.IJMULTIPHASEFLOW.2014.03.008
- Venkata, S.K., Roy, B.K., 2012. An Intelligent Flow Measurement Scheme using Ultrasonic Flow Meter, in: Modelling, Identification and Control / 770: Advances in Computer Science and Engineering. ACTAPRESS, Calgary,AB,Canada. doi:10.2316/P.2012.769-033
- Wang, H., Liu, S., Fan, J., Yang, W., 2003. 3D Presentation of Images with Capacitance Tomography, in: 3rd World Congress on Industrial Process Tomography. Banff, Canada, pp. 331–336.
- Warsito, W., Fan, L.-S., 2005. Dynamics of spiral bubble plume motion in the entrance region of bubble columns and three-phase fluidized beds using 3D ECT. Chem. Eng. Sci. 60, 6073–6084. doi:10.1016/j.ces.2005.01.033
- Warsito, W., Fan, L.-S., 2003. Development of three-dimensional electrical capacitance tomography, in: Proc. 3rd World Congress on Industrial Process Tomography (Banff). p. 391.
- Warsito, W., Marashdeh, Q., Fan, L.S., 2007. Some comments on “Spatial imaging with 3D capacitance measurements.” Meas. Sci. Technol. 18, 3665–3667. doi:10.1088/0957-0233/18/11/N01
- Xie, T., Ghiaasiaan, S.M., Karrila, S., 2004. Artificial neural network approach for flow regime classification in gas–liquid–fiber flows based on frequency domain analysis of pressure signals. Chem. Eng. Sci. 59, 2241–2251. doi:10.1016/j.ces.2004.02.017
- Yang, W.Q., Peng, L., 2003. Image reconstruction algorithms for electrical capacitance tomography. Meas. Sci. Technol. 14, R1–R13. doi:10.1088/0957-0233/14/1/201
- York, T., Mazurkiewicz, L., Polydorides, N., Mann, R., Grieve, B., 2003. Image Reconstruction for Pressure Filtration Using EIDORS 3D, in: 3rd World Congress on Industrial Process Tomography. p. 559.
- Zadeh, L.A., 1999. Fuzzy sets as a basis for a theory of possibility. Fuzzy Sets Syst. 100, 9–34. doi:10.1016/S0165-0114(99)80004-9
- Zargaran, A., Mozaffari, E., Giddings, D., 2016. Gas-liquid slip velocity determination in co-current column flotation. Sep. Purif. Technol. 169, 179–186. doi:10.1016/j.seppur.2016.05.018
- Zhang, W., Wang, C., Yang, W., Wang, C.-H., 2014. Application of electrical capacitance tomography in particulate process measurement – A review. Adv. Powder Technol. 25, 174–188. doi:10.1016/j.apt.2013.12.003
- Zhu, Z.T., Wang, Y., Zhao, L.F., Ning, C., Xie, S.F., Liu, Z.C., 2015. The effect of gas fraction on centrifugal pump. IOP Conf. Ser. Mater. Sci. Eng. 72, 32022. doi:10.1088/1757-899X/72/3/032022